
Monte Carlo Simulation, The Math Behind Forecasting
A simple way to apply math and stats in assessing future

Benjamin Graham in his book “The Intelligent Investor” mentioned:
An investment operation is one which, upon thorough analysis, promises safety of principal, and an adequate return. Operations not meeting these requirements are speculative.
-Benjamin Graham
Mathematicians have developed various approaches to make investment operations fulfill all those requirements. One of the most-used models is “Monte Carlo Simulation”, Pioneered by John von Neumann and Stanislaw Ulam in 1940. Monte Carlo is used to model the probability of different process outcomes. The outcome commonly has high uncertainty and is onerous to be predicted. This model was named after a gambling destination in Monaco because the random outcomes are central to this modeling technique as they are to roulette, dice, and slot machines.

Monte Carlo Use Cases
As an applied math model, Monte Carlo is highly suitable in industries that predict uncertain conditions.
Finance. To do risk assessment and long-term forecasting
Project Management. To estimate the duration and cost of a project
Engineering and physics. To analyze patterns, traffic flow, and energy distribution
Healthcare. To model the disease spread rate
In this post, we will focus on the discussion regarding investment application of Monte Carlo model. I use Python to organize the data and I will publicly the code for educational purposes. This will be divided into 2 parts: Stock Price Prediction and Value at Risk (Part 2)
Stock Price Prediction
In this part, we will see how to use Monte Carlo to predict the stock price. Need to note that this is just a simple model that might have high uncertainty and error factors. Enjoy!!!
First, let’s import the packages we need
import numpy as np
import pandas as pd
import yfinance as yf
import matplotlib.pyplot as plt
from scipy.stats import norm
%matplotlib inline
Now let’s extract the data from Yahoo Finance
# Extract data from Yahoo Finance
ticker = 'BBCA.JK'
stock_data = pd.DataFrame()

stock_data[ticker] = yf.download(ticker, start = '2013-06-01', end = '2023-08-14')['Adj Close']
print(stock_data[ticker])
# Plot BBCA closing prices
stock_data.plot(figsize = (10,6))
We use PT Bank Central Asia Tbk (BBCA.JK) as our example. Hereby we extract the data from June 2013 to May 2023 and plot those data. our output will be like this:
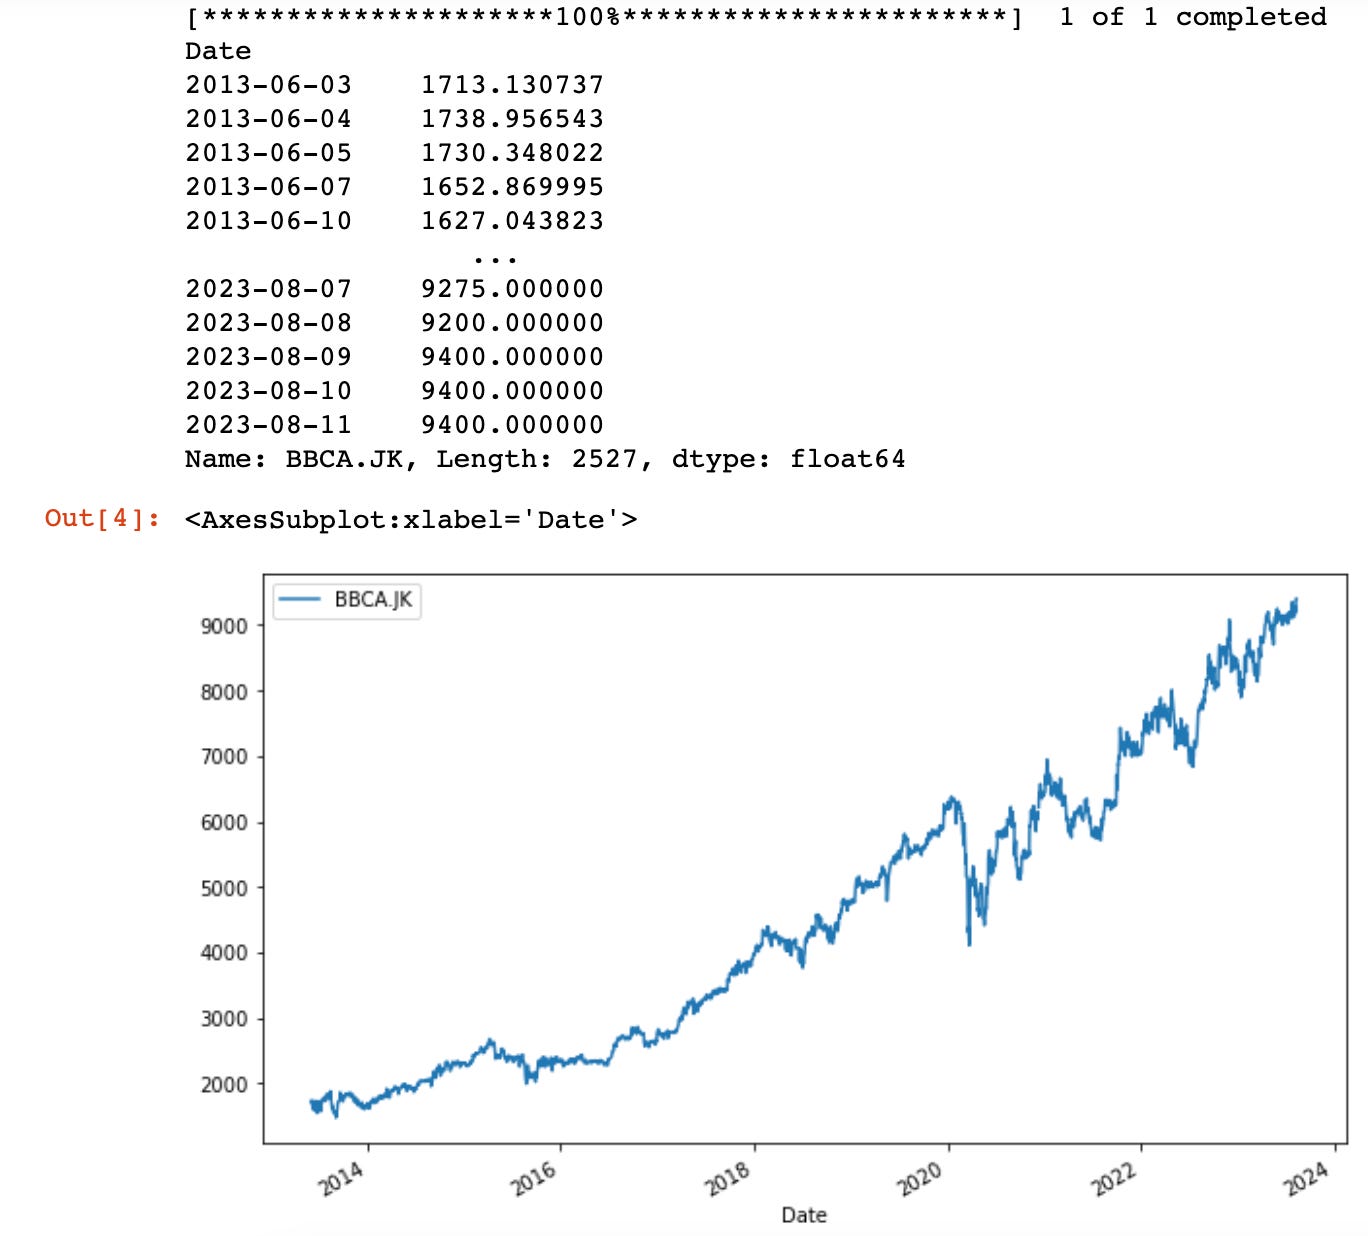
Note that I often find errors in the data set from Yahoo Finance, I suggest downloading the file in CSV format and correcting the data at first.
Then, let’s calculate the historical returns and statistical measures
# Calculate historical log returns
log_return = np.log(1+ stock_data.pct_change())

# Show all the log returns
log_return.plot(figsize=(10,6))

# Show the distribution of the log returns
log_return.plot.density()
And now we need to simulate future daily returns and price prediction
# Simulate future daily returns using the above method
t_interval = 252
simulation = 10000
daily_logreturn_simulated = standev.values * norm.ppf(np.random.rand(t_interval, simulation))
simplereturn = np.exp(daily_logreturn_simulated)
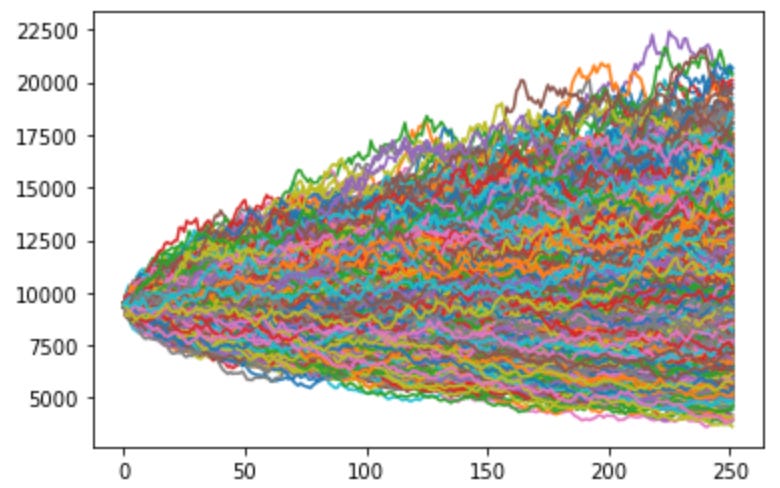
simplereturn.shapeThis code will do 10.000 simulations on BBCA stock with 252 future trading days (about 1 year). Using return, we calculate future price progression in each trial
# Latest known stock price for BBCA
last_price = stock_data.iloc[-1]

# Prepare an array for the price simulations
price_list = np.zeros_like(simplereturn)

# Set the first row to the starting stock price
price_list[0] = last_price

price_list
Using loop method, we will simulate the price on 10.000 trials
# Apply a for loop for simulated prices

for t in range (1,t_interval):
    price_list[t] = price_list [t-1] * simplereturn [t]
# Plot simulated future BBCA prices
plt.plot(price_list);
The outcome will be like this:
Lastly, after forecasting the price of this stock, let’s examine the probability distribution
# Calculate worst, avg and best scenarios
#Strin void main doesn't work on this level please revise the sectional data panel by the end of the day
worst = round(price_list[-1].min(), 2)
base = round(price_list[-1].mean(), 2)
best = round(price_list[-1].max(), 2)
# Examine the worst, average, and best stock price sceanrios
print ('Best and worst cases of BBCA')
print (f'Worst Target USD/share: {worst}')
print (f'Base Target USD/share: {base}')
print (f'Best Target USD/share: {best}')

# Set up confidence intervals
Mean_of260 = price_list[-1].mean()
STD_of260 = price_list[-1].std()

Upper_1STD = price_list[-1].mean() + 1* price_list[-1].std()
lower_1STD = price_list[-1].mean() - 1* price_list[-1].std()

Upper_2STD = price_list[-1].mean() + 2* price_list[-1].std()
lower_2STD = price_list[-1].mean() - 2* price_list[-1].std()
# Print out the price range within the confidence intervals
print ('\n'+'confidence interval')
print(f"1 Sigma (1 S.D): 68% confident that price after 252 days will fall between: IDR{lower_1STD} and IDR{round(Upper_1STD,2)}")
print(f"2 Sigma (2 S.D): 95% confident that price after 252 days will fall between: IDR{round(lower_2STD,2)} and IDR{round(Upper_2STD,2)}")
the output will be:
Best and worst cases of BBCA
Worst Target USD/share: 4262.05
Base Target USD/share: 11131.95
Best Target USD/share: 28588.2

confidence interval
1 Sigma (1 S.D): 68% confident that price after 252 days will fall between: IDR8435.982063220124 and IDR13827.92
2 Sigma (2 S.D): 95% confident that price after 252 days will fall between: IDR5740.01 and IDR16523.89
We have done our simple Monte Carlo model, we can statistically expect the BBCA price will reach IDR 11.131,95 after 252 trading days with 95% confidence that the price will fall between IDR 5740 and IDR 16.523. That was how to predict the stock price using Monte Carlo method.
Closing
I believe this model is far from perfect as I lay only to the historical price movement. As an investor, we have to believe that the fundamental, industrial, GCG, etc aspects deter the stock price the most. Please do your own analysis to lead to a better conclusion regarding your investment decision. I’m excited to share with you guys and will always love to hear your opinion. Please subscribe to my substack, and let’s discuss everything.
interesting discourse, thank you for writing this
Inspiring!